
According to ATX Things' analysis of FRED data for the Austin, Texas metro (as of October 1, 2026), the median home listing price fell to $439,650 in October 2026, the lowest monthly reading since January 2021 and the fifth straight monthly drop. That is $50,203 (10.2%) below October 2025. Mortgage rates rose over the same year, so the monthly payment on that median-priced home barely changed: up about $4.
How Low Are Austin Home Listing Prices Now?
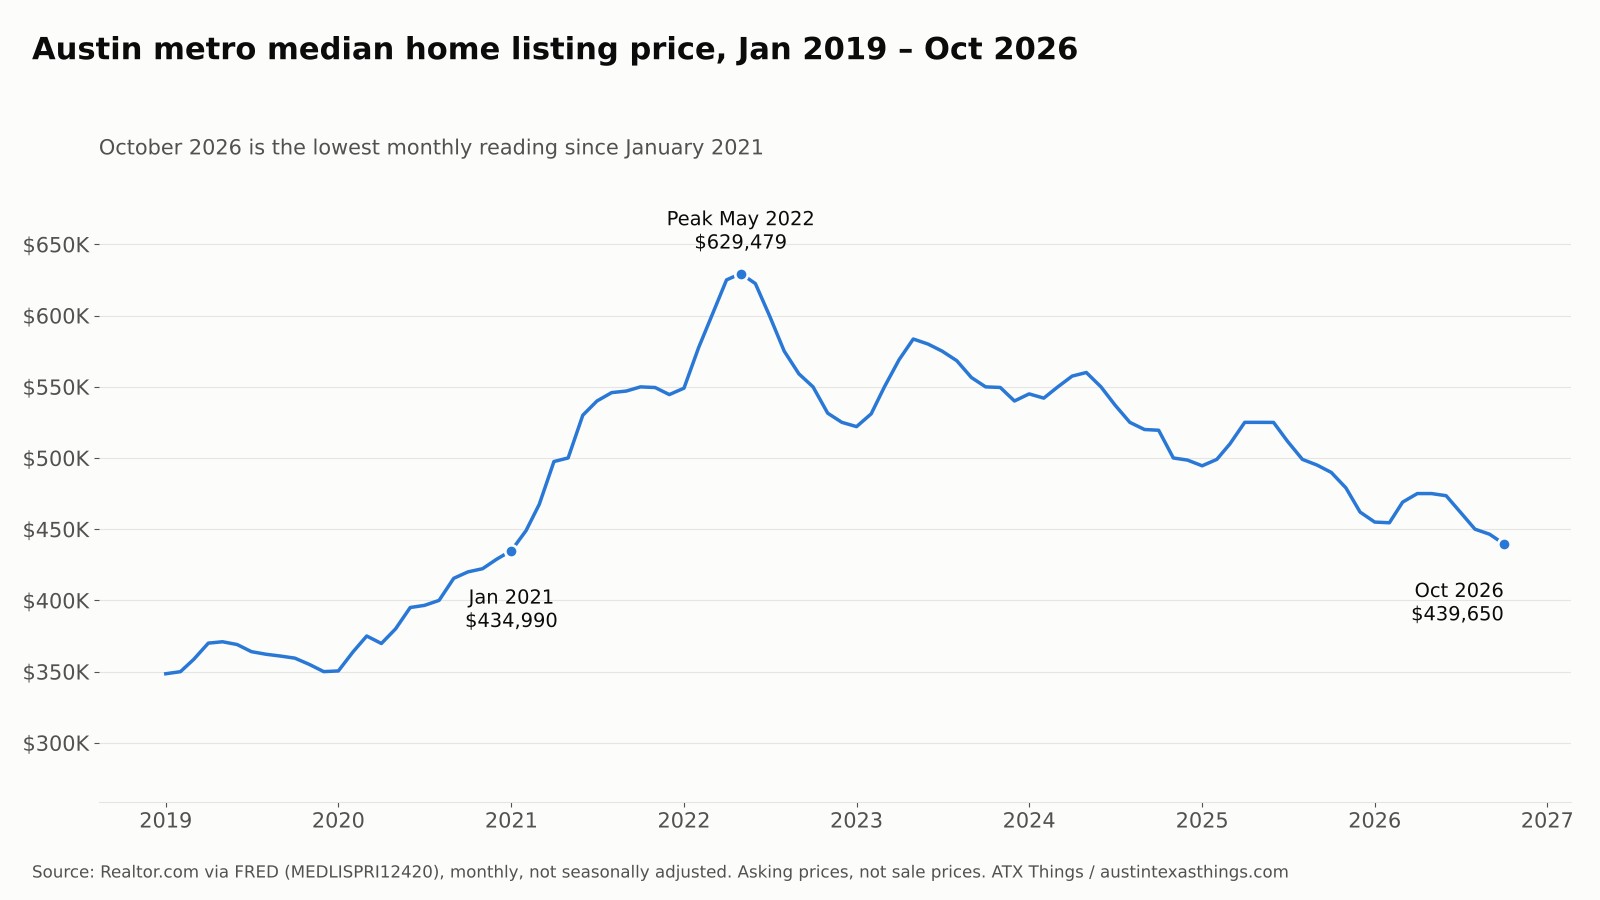
The metro's median listing price (what sellers are asking, not what homes sold for) was $439,650 in October 2026. The last time a monthly reading was lower was January 2021, at $434,990. The series peaked at $629,479 in May 2022, so today's median is $189,829 (30.2%) below that high.
The last five months have all been lower than the month before:
| Month | Median listing price | Change from prior month |
|---|---|---|
| May 2026 | $475,000 | $0 |
| Jun 2026 | $473,500 | −$1,500 |
| Jul 2026 | $461,966 | −$11,534 |
| Aug 2026 | $450,000 | −$11,966 |
| Sep 2026 | $446,450 | −$3,550 |
| Oct 2026 | $439,650 | −$6,800 |
| Oct 2025, for comparison | $489,853 |
Two inventory measures from the same source moved less. Active listings were 11,631 in October 2026, up 1.3% from 11,487 a year earlier and down from a July high of 12,655. The median home had been listed for 84 days, compared with 79 days in October 2025. Our housing data tool holds the full series. This report describes what has already happened; it makes no forecast about the next reading.
If Prices Fell $50,000, Why Didn't the Monthly Payment Drop?
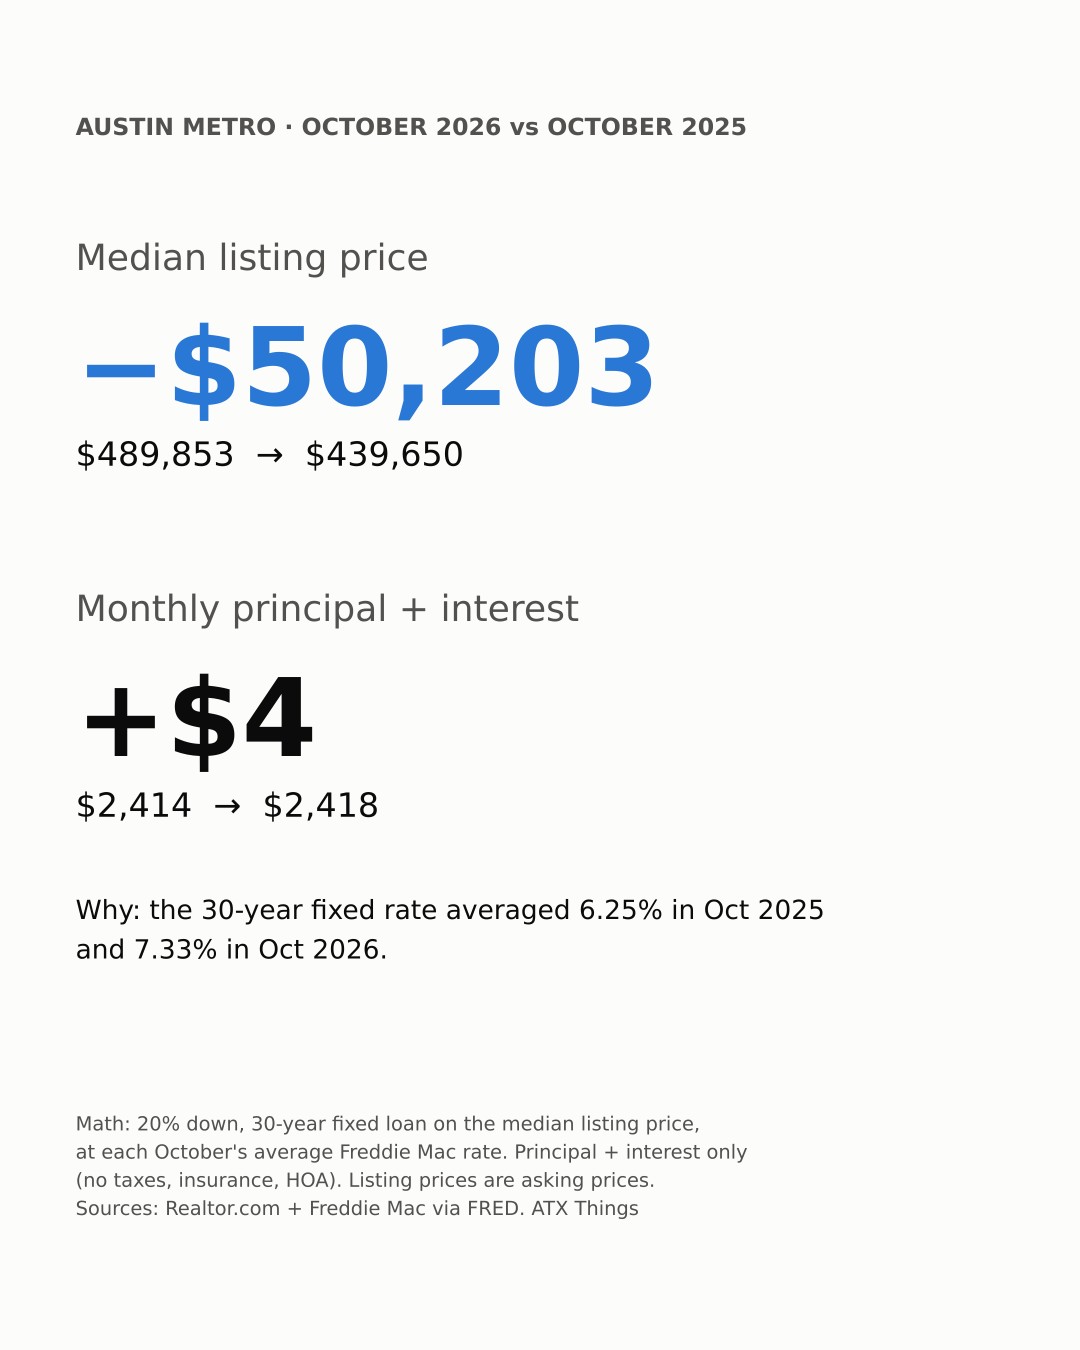
Because rates went up by about as much as prices came down. Here is the arithmetic, using the median listing price, 20% down and a 30-year fixed loan at each October's average rate from Freddie Mac's weekly survey:
| October 2025 | October 2026 | |
|---|---|---|
| Median listing price | $489,853 | $439,650 |
| 20% down payment | $97,971 | $87,930 |
| Loan amount | $391,882 | $351,720 |
| Average 30-year fixed rate (October) | 6.25% | 7.33% |
| Monthly principal + interest | $2,414 | $2,418 |
So a buyer at the median needs about $10,041 less cash up front than a year ago, and the monthly principal-and-interest payment is about the same. The weekly rate has eased since mid-October, to 7.11% in the November 12, 2026 survey. At that rate the same October 2026 loan works out to about $2,366 a month.
This is a payment on an asking price, not a quote. It leaves out property taxes, insurance and HOA dues, which in Central Texas can add a large share on top. Your rate depends on your credit, loan type and points.
How Does Austin Compare With Dallas, Houston and San Antonio?
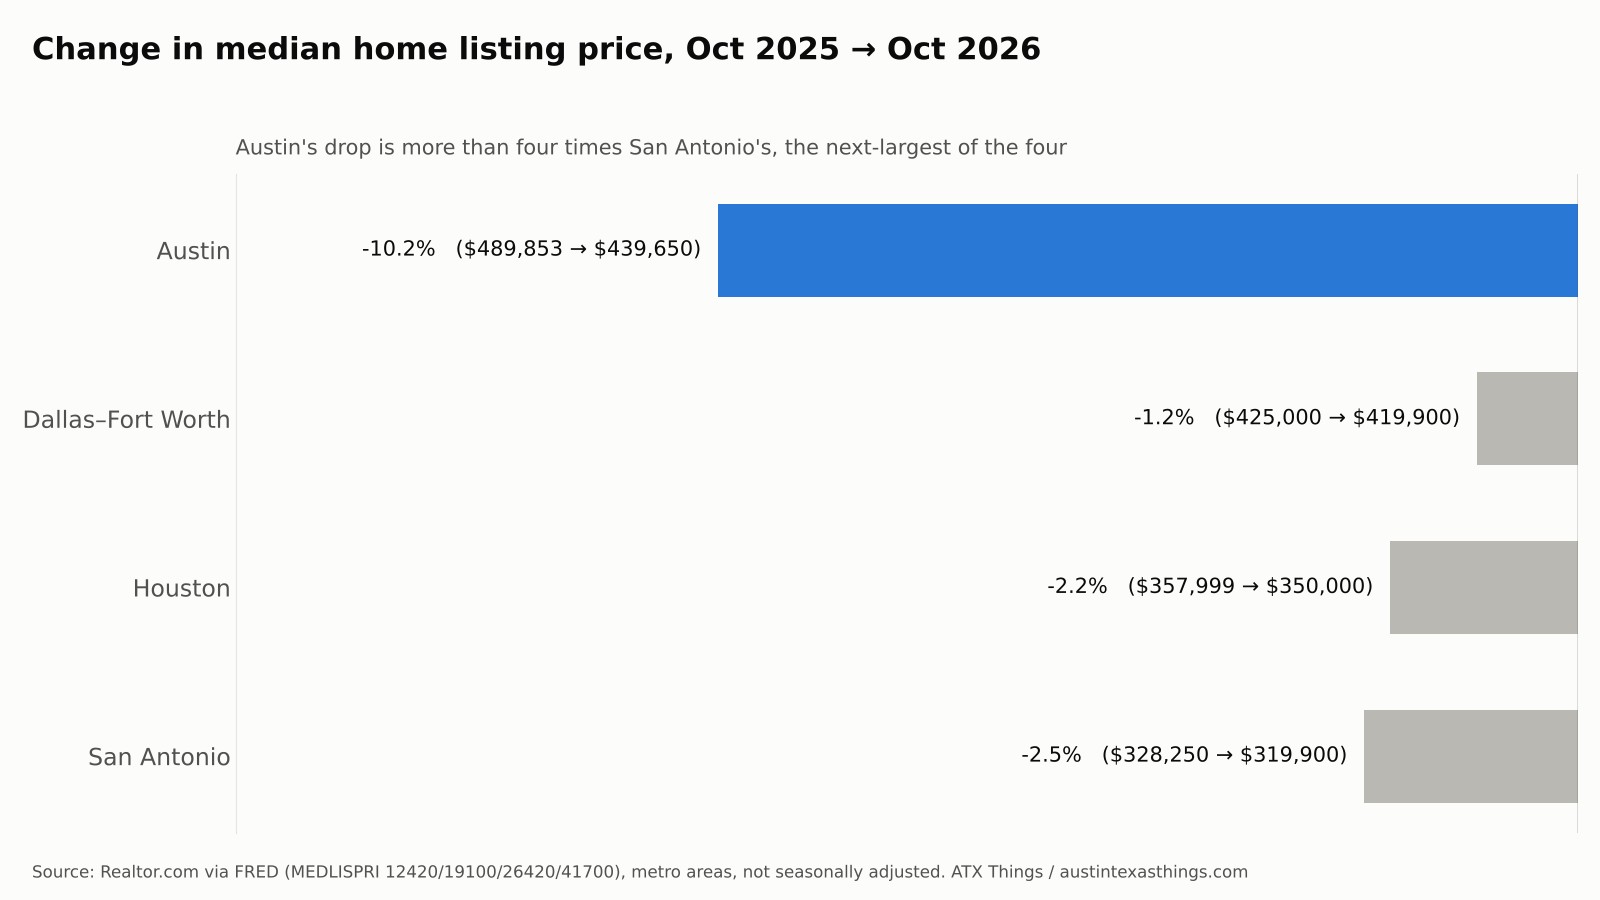
Austin's listing-price drop is the steepest of Texas' four largest metros, and its unemployment rate is the lowest. All four metros' median listing prices are lower than a year ago.
| Metro | Median listing price, Oct 2026 | Oct 2025 | Change | Unemployment, Sep 2026 | Sep 2025 |
|---|---|---|---|---|---|
| Austin | $439,650 | $489,853 | −10.2% | 3.7% | 3.6% |
| Dallas–Fort Worth | $419,900 | $425,000 | −1.2% | 4.2% | 4.0% |
| Houston | $350,000 | $357,999 | −2.2% | 4.7% | 4.6% |
| San Antonio | $319,900 | $328,250 | −2.5% | 4.3% | 4.1% |
Unemployment in this table is FRED's smoothed seasonally adjusted series, so all four metros are on the same footing. A year ago, Austin's median listing price was $64,853 above Dallas–Fort Worth's. In October 2026 the gap was $19,750.
Is Austin's Unemployment Rate Still Above Last Year's?
Not anymore. On the not-seasonally-adjusted basis our tracker uses, the Austin-Round Rock-Georgetown metro's unemployment rate was 3.7% in September 2026, the same as September 2025. From April through August, every month was above the same month a year earlier. That gap peaked at 0.6 point in June (4.1% vs 3.5%), then narrowed to 0.4 in July, 0.1 in August and zero in September. (On the seasonally adjusted basis in the table above, September is 0.1 point higher than a year ago.)
The three core counties tell the same story:
| County | Sep 2026 | Sep 2025 | Change | June 2026 |
|---|---|---|---|---|
| Travis | 3.6% | 3.6% | 0.0 pt | 4.0% |
| Williamson | 3.7% | 3.8% | −0.1 pt | 4.2% |
| Hays | 3.7% | 3.7% | 0.0 pt | 4.1% |
| Austin metro | 3.7% | 3.7% | 0.0 pt | 4.1% |
Williamson is the only one of the three below its year-earlier rate. Last month's report had all three 0.1 to 0.2 point above. County rates are on the county economy page.
We are still leaving Dallas and Harris counties out of county comparisons. The tracker's rows for both carry labor-force counts (3,798 and 32,325) far too small for those counties, the same problem we flagged in our October report. The metro table above uses FRED's metro series instead, which do not have this problem.
Are Austin Employers Still Adding Jobs?
Yes, compared with a year ago, but not since June. Seasonally adjusted nonfarm payrolls in the metro were 1,421,100 in September 2026, up 12,900 (0.9%) from September 2025. Payrolls peaked at 1,426,300 in June and have dipped in each month since, down 5,200 in total. Average weekly earnings for private-sector workers were $1,319.27 in September, up 4.4% from $1,263.68 a year earlier (not seasonally adjusted, so single months can be noisy). The jobs data page has county-level detail.
Is Austin Still Building?
Permits jumped in September. FRED's seasonally adjusted count of new private housing authorized by building permits in the metro was 3,108 in September 2026, up 22.1% from 2,547 in September 2025 and up 75.7% from August's 1,769. It is the highest monthly reading since May 2025. This series swings a lot from month to month (August 2025 was 1,087), so one month is not a trend.
For the projects behind the numbers, see our Austin Development Report for November 2026 and the project-level filings on Zabalist's project tracker. The Austin metro economy tool holds the live series.
Listing prices are asking prices. Before you make an offer, compare a listing with recorded sales nearby, and price out taxes and insurance, not just principal and interest.
What Should Locals Know?
- Median listing price: $439,650 in October 2026, the lowest since January 2021 and $50,203 below October 2025.
- Monthly payment: about $2,418 principal and interest at 20% down and October's 7.33% average rate, versus $2,414 a year ago.
- Texas comparison: Austin's −10.2% is the steepest listing-price drop of the four largest metros; its 3.7% unemployment is the lowest.
- Unemployment: 3.7% in September 2026, the same as a year earlier, after five months above it.
- Jobs: 1,421,100, up 0.9% from a year ago and 5,200 below June.
- Permits: 3,108 in September, the highest since May 2025.
Method & Sources
Source line: FRED / U.S. Bureau of Labor Statistics via ATX Things economy tracker, as of 2026-10-01 (the tracker's latest observation date). Listing prices, active listings and days on market are Realtor.com series on FRED (metro codes 12420 Austin, 19100 Dallas–Fort Worth, 26420 Houston, 41700 San Antonio), monthly and not seasonally adjusted, through October 2026. Unemployment is BLS Local Area Unemployment Statistics through September 2026: metro and county not-seasonally-adjusted rates from our tracker (checked against FRED series AUST448URN), and FRED's smoothed seasonally adjusted series for the four-metro comparison. BLS published no October 2025 reading. Payrolls (AUST448NA) and average weekly earnings are BLS Current Employment Statistics through September 2026. Building permits are Census Bureau data (AUST448BPPRIVSA), seasonally adjusted, through September 2026. Mortgage rates are Freddie Mac's weekly 30-year fixed average (MORTGAGE30US); "October average" is the mean of that month's five weekly readings. Payment math is standard 30-year amortization, principal and interest only, rounded to the dollar. Our tracker lists payroll growth as 1.5%, but that figure compares September 2026 with October 2025; we report the September-to-September change instead. We did not use the tracker's GDP figure (2023, from a discontinued FRED series) or its wage figure, which we could not match to a FRED series. All figures are the latest published values and earlier months can be revised. Previous editions: October 2026 and September 2026. Our economy hub covers sales tax, hotel tax and jobs.
FAQ
What is the median home listing price in Austin right now?
The Austin metro's median listing price was $439,650 in October 2026, according to Realtor.com data on FRED. That is the lowest monthly reading since January 2021 ($434,990), 10.2% below October 2025 ($489,853) and 30.2% below the May 2022 peak of $629,479. It is an asking price, not a sale price.
Are Austin home payments cheaper than last year?
Not much. At 20% down and October's average 30-year fixed rate, principal and interest on the median listing was about $2,418 a month in October 2026, versus $2,414 in October 2025. Prices fell about 10%, but the average rate rose from 6.25% to 7.33%. The cash needed for a 20% down payment fell about $10,041.
What is Austin's unemployment rate?
The Austin-Round Rock-Georgetown metro's unemployment rate was 3.7% in September 2026 (not seasonally adjusted), the same as September 2025. It peaked at 4.1% in June 2026. Travis County was 3.6%, Williamson 3.7% and Hays 3.7%. Austin's seasonally adjusted rate was the lowest of Texas' four largest metros.
Are home prices falling faster in Austin than in other Texas cities?
Yes, by this measure. From October 2025 to October 2026, Austin's median listing price fell 10.2%, compared with 2.5% in San Antonio, 2.2% in Houston and 1.2% in Dallas–Fort Worth. Austin's premium over Dallas–Fort Worth narrowed from $64,853 to $19,750.
How often is this report updated?
ATX Things publishes the Austin Economy Snapshot monthly, around the 16th, using the newest FRED readings available. Each edition states its as-of dates. Follow @austintexasthings for the December edition.
Related Austin Data
Share this article