According to ATX Things' analysis of FRED data for the Austin, Texas metro (as of September 1, 2026), the median home listing price fell to $446,450 in September 2026, the lowest of the 12 monthly readings in our tracker (October 2025 to September 2026) and the fourth straight monthly decline since May's $475,000. It is 9.8% below September 2025, a gap of about $48,550. Over the same stretch, Austin-area unemployment jumped in June, then eased two months in a row to 3.9% in August.
How Far Have Austin Home Listing Prices Fallen?
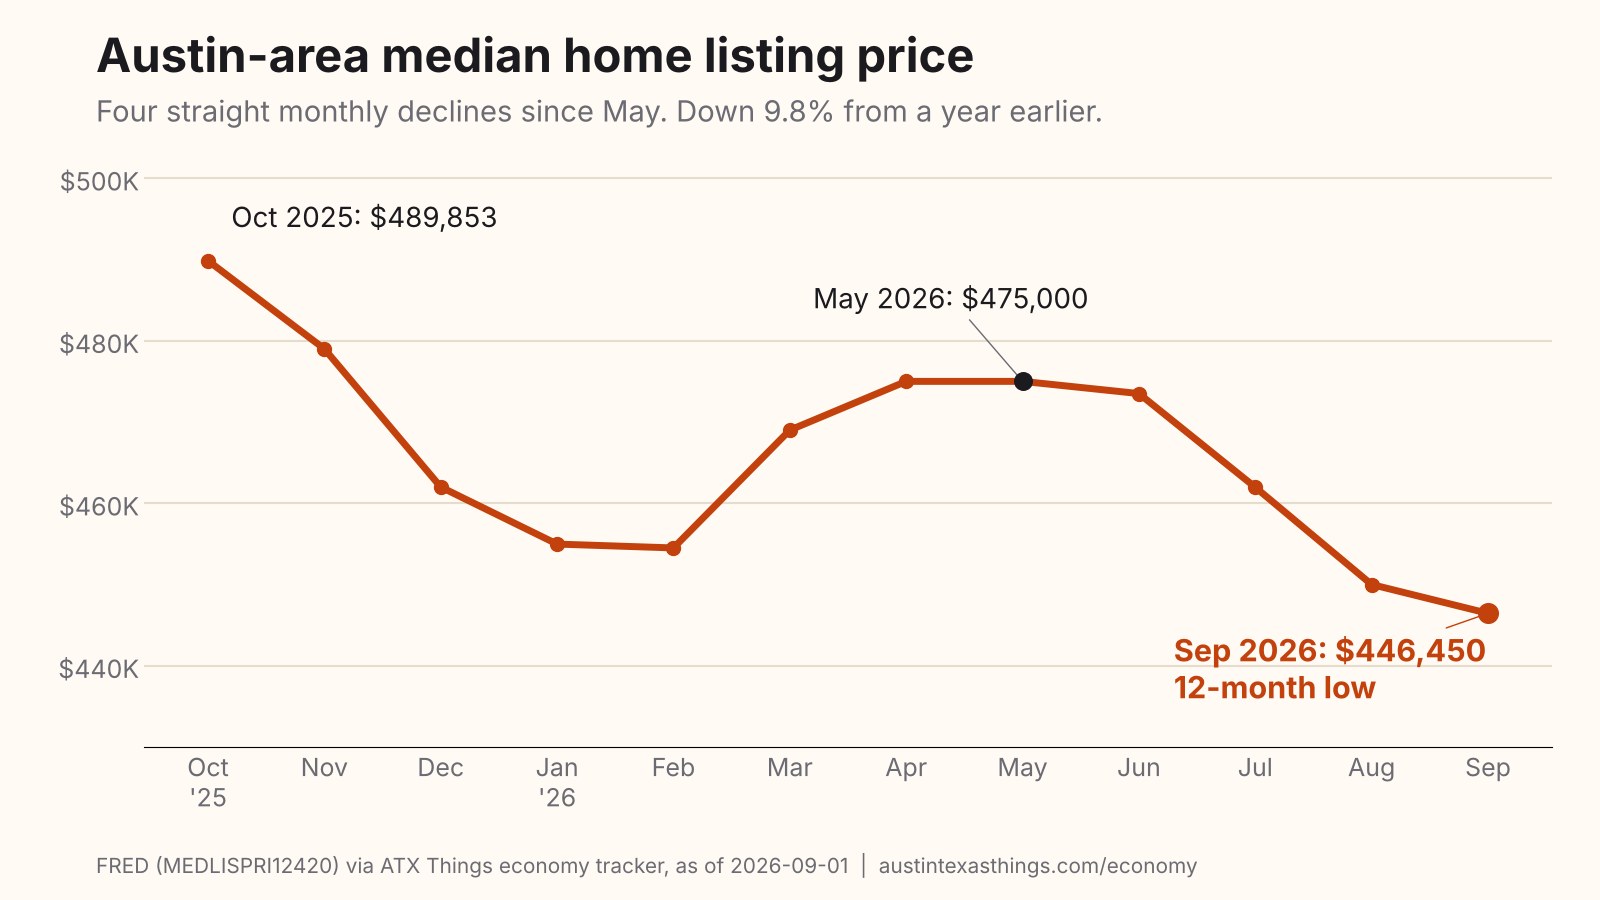
The metro's median listing price (what sellers are asking, not what homes sold for) was $446,450 in September 2026. Here is the arithmetic: September 2025's median works out to $495,000 (the series' 9.8% year-over-year decline, run backward), so a typical listing is asking about $48,550 less than a year ago. The month-by-month path is not a one-way slide:
| Month | Median listing price |
|---|---|
| Oct 2025 | $489,853 |
| Dec 2025 | $462,000 |
| Feb 2026 | $454,500 |
| May 2026 | $475,000 |
| Jun 2026 | $473,500 |
| Jul 2026 | $461,966 |
| Aug 2026 | $450,000 |
| Sep 2026 | $446,450 |
The series fell from October to February, rose from February to May, and has fallen every month since. That is a description of what already happened. This report makes no forecast about the next reading.
Two other housing measures from the same FRED data, both as of the latest reading: active listings stand at 12,083 (up 1.5% from a year earlier, and down from a July high of 12,655), and the median home has been listed for 80 days (up 1.3% year over year). In our September report, days on market was down 7.6% year over year, so that measure has moved from faster to slightly slower. FRED's separate House Price Index, which follows repeat sales of the same homes, was up 0.3% year over year in its latest quarterly reading. See the full series on our housing tool.
Is Austin's Unemployment Rate Still Climbing?
Not in the last two months. The Austin-Round Rock-Georgetown metro's unemployment rate was 3.9% in August 2026, compared with 3.8% in August 2025, a year-over-year gap of 0.1 point. In our September report the July gap was 0.4 point (4.0% vs 3.6%). The rate stood at 3.5% in May, jumped 0.6 point to 4.1% in June, then eased to 4.0% in July and 3.9% in August.
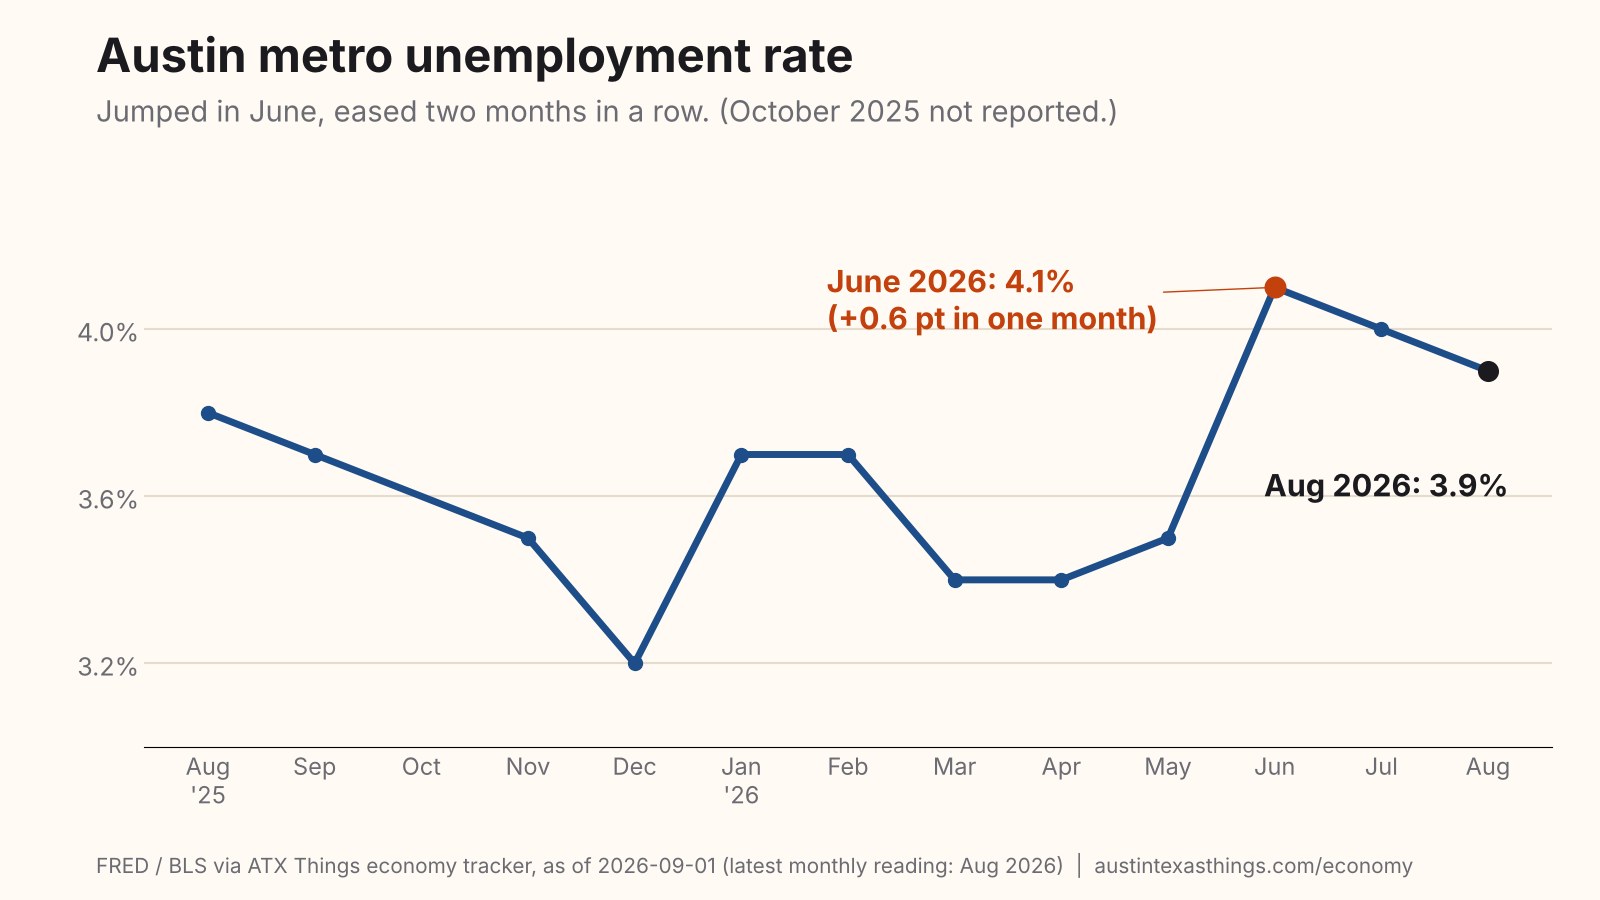
FRED has no October 2025 unemployment reading for the Austin metro, so the chart skips that month rather than filling it in.
How Do Austin-Area Counties Compare With San Antonio's?
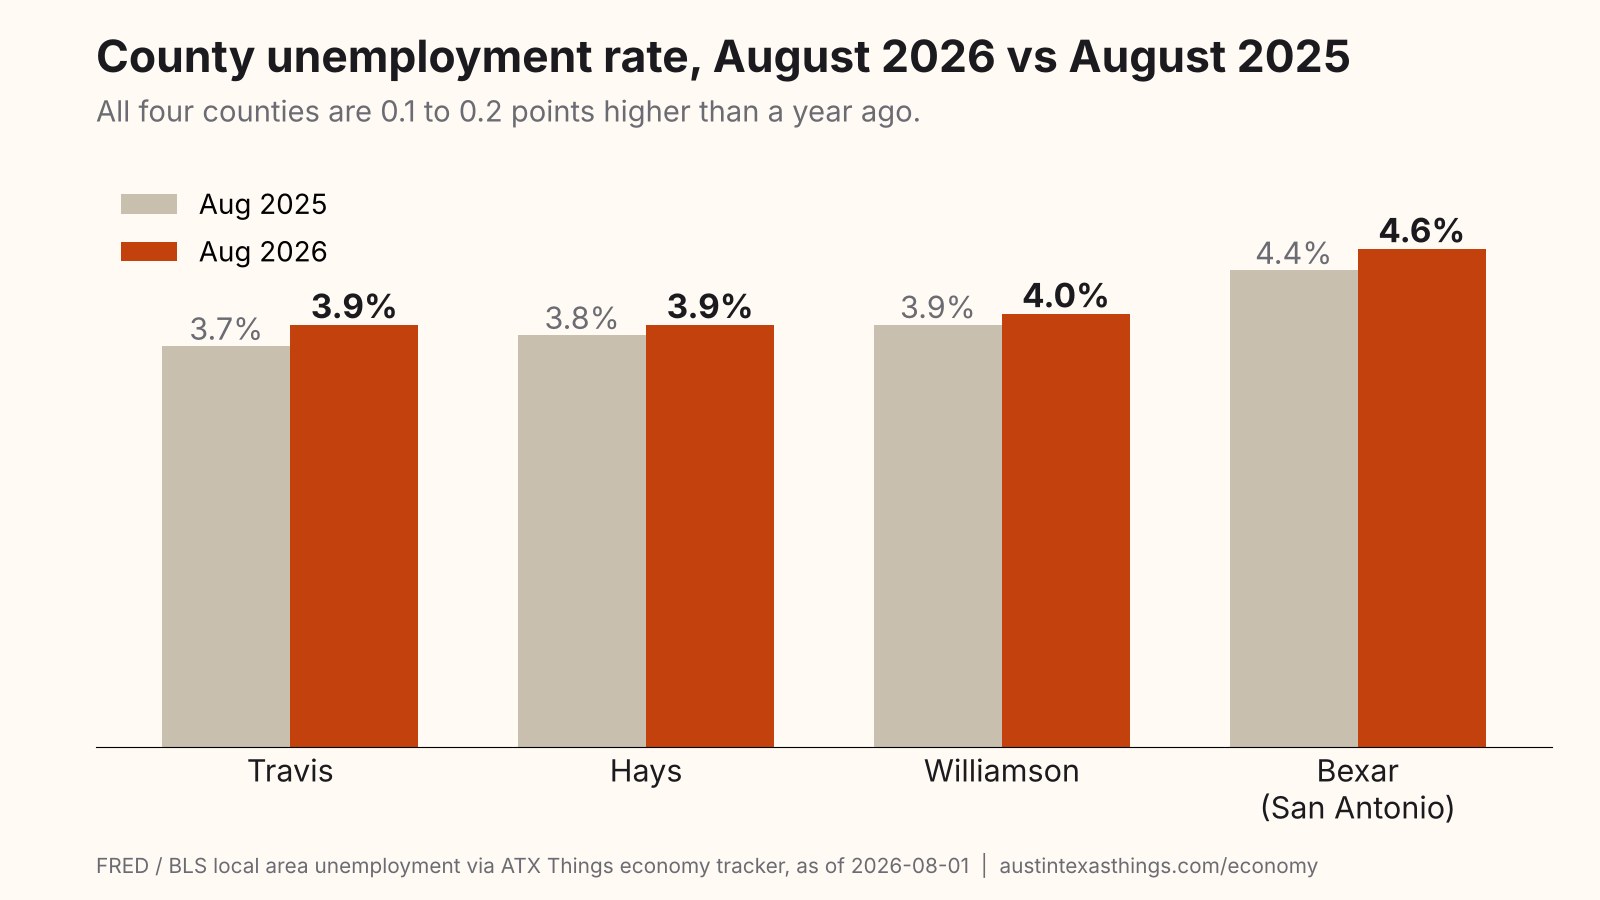
All four counties we can verify are 0.1 to 0.2 point higher than a year ago, and all four peaked in June. Bexar County (San Antonio) runs about 0.7 point above Travis.
| County | Aug 2026 | Aug 2025 | Change | June 2026 peak |
|---|---|---|---|---|
| Travis | 3.9% | 3.7% | +0.2 pt | 4.0% |
| Hays | 3.9% | 3.8% | +0.1 pt | 4.1% |
| Williamson | 4.0% | 3.9% | +0.1 pt | 4.2% |
| Bexar (San Antonio) | 4.6% | 4.4% | +0.2 pt | 4.8% |
| Austin metro (all five counties) | 3.9% | 3.8% | +0.1 pt | 4.1% |
Correction to our September 2026 report. That report's county table included Dallas and Harris counties. On re-checking, the tracker's Dallas and Harris rows carry labor-force counts (3,756 and 32,404) far too small for those counties, and the Harris row is identical to the Harrison County row, so those two figures were not Dallas or Harris County rates. We have left both out this month and are not comparing against Dallas or Houston until the series are fixed. The Bexar figures pass the same check (a labor force of about 1.05 million).
Is Austin Still Building?
Construction employment in the metro was 97,928 jobs in August 2026, up 4.2% from a year earlier (a dip from 98,377 in July). Total nonfarm employment was 1,424,000, up 1.1%, and average weekly wages were $1,851, up 5.6% in the latest reading. The tracker's building-permit count for August is 1,727, versus 2,063 in July. We are not reporting a year-over-year permit change this month: the tracker's figure swung from −11.4% in our September report to +63.4% now, and the 12 months of history we hold do not include the August 2025 comparison month, so we cannot verify it.
For the projects behind those jobs, see our Austin Development Report for October 2026 and the project-level filings on Zabalist's project tracker. Our September economy report has the earlier readings, and the Austin metro tool and jobs data hold the live series.
Listing prices are asking prices. For what homes actually sold for, check recorded sale data for your own neighborhood rather than relying on a metro-wide listing median.
What Should Locals Know?
- Median listing price: $446,450 in September 2026, the lowest of the last 12 monthly readings and about $48,550 below September 2025.
- Unemployment: 3.9% in August 2026 (3.8% a year earlier), after a June jump to 4.1%.
- Texas comparison: Bexar County (San Antonio) was 4.6% in August 2026, up 0.2 point from a year earlier; Travis was up 0.2 point to 3.9%.
- Method: each figure is the latest value in the tracker's FRED series for the date shown; year-over-year changes are computed from the same series; nothing here is a forecast.
Frequently Asked Questions
What is Austin's median home price right now? The median home listing price for the Austin-Round Rock-Georgetown metro was $446,450 in September 2026 (FRED series MEDLISPRI12420, as of September 1, 2026), down 9.8% from September 2025. It measures asking prices, not closed sales.
What is Austin's unemployment rate? 3.9% in August 2026, the latest monthly reading, versus 3.8% in August 2025. It peaked at 4.1% in June 2026.
Is Austin unemployment higher than San Antonio's? No. In August 2026 Travis County was 3.9% and Williamson 4.0%, while Bexar County (San Antonio) was 4.6%. These are county rates, not full metro rates.
Where does this data come from? FRED (Federal Reserve Bank of St. Louis) and the U.S. Bureau of Labor Statistics, via the ATX Things economy tracker. Series dates: metro housing and jobs as of 2026-09-01; county unemployment as of 2026-08-01.
Does a lower listing price mean my home lost value? Not necessarily. The listing median reflects which homes are on the market in a given month. FRED's repeat-sales House Price Index, which follows the same homes over time, was up 0.3% year over year in its latest reading.
Source: FRED / U.S. Bureau of Labor Statistics via ATX Things economy tracker, as of 2026-09-01 (metro) and 2026-08-01 (counties). Direct series: MEDLISPRI12420, ATNHPIUS12420Q, TXTRAV3URN. Explore the live data on our economy dashboard.
Related Austin Data
More Austin Guides
Share this article