According to ATX Things' analysis of the latest FRED data for the Austin, Texas metro, the median home listing price fell 9.6% year-over-year to $461,887 in July 2026, and unemployment climbed in Travis, Williamson, and Hays counties alike. Building permits are down 11.2% year-over-year, even as wages and construction employment both kept growing.

Where Does Austin's Economy Stand in July 2026?
Two numbers define this month's snapshot, and they're pulling in different directions. The Austin-Round Rock-Georgetown metro's unemployment rate hit 4.1% in June 2026, up six-tenths of a point from 3.5% a year earlier — the highest reading in the 12-month window FRED has on file for this metro. At the same time, the median home listing price across the metro dropped to $461,887 in July 2026, down 9.6% from the same point last year. That's a real, calculable drop of roughly $49,000 off a comparable year-ago listing price.
Building permits tell a related story: the metro logged 1,681 permits in June 2026, an 11.2% pullback from a year earlier. But two other indicators moved the opposite way — average weekly wages rose 5.4% to $1,836, and construction employment actually grew 6.6% to 98,375 jobs, even as new permit filings slowed. Those numbers don't cancel each other out; they're simply four different parts of the same economy moving at different speeds this month.
| Indicator | Latest reading | As of | Year-over-year |
|---|---|---|---|
| Unemployment rate | 4.1% | June 2026 | +0.6 pt vs. June 2025 |
| Median home listing price | $461,887 | July 2026 | −9.6% |
| Building permits | 1,681 | June 2026 | −11.2% |
| Metro GDP | $248.1 billion | latest available | not tracked YoY in this dataset |
| Average weekly wage | $1,836 | latest available | +5.4% |
| Active home listings | 12,655 | July 2026 | −3.6% |
| Median days on market | 67 days | July 2026 | −6.9% |
| Construction employment | 98,375 jobs | June 2026 | +6.6% |
| Labor force | 1,562,547 | June 2026 | +0.4% |
Population isn't tracked in this dataset's Austin metro row — FRED's population series for this metro wasn't available at the time of this pull, so we're not stating a figure we can't verify.
Unemployment Rose in Every Core County — Travis, Williamson, and Hays Alike
This isn't a one-county blip. All three of the metro's core counties moved the same direction, by close to the same amount, in the same month.
| County | Unemployment, June 2026 | June 2025 | Point change |
|---|---|---|---|
| Travis | 4.0% | 3.4% | +0.6 pt |
| Williamson | 4.2% | 3.5% | +0.7 pt |
| Hays | 4.1% | 3.4% | +0.7 pt |
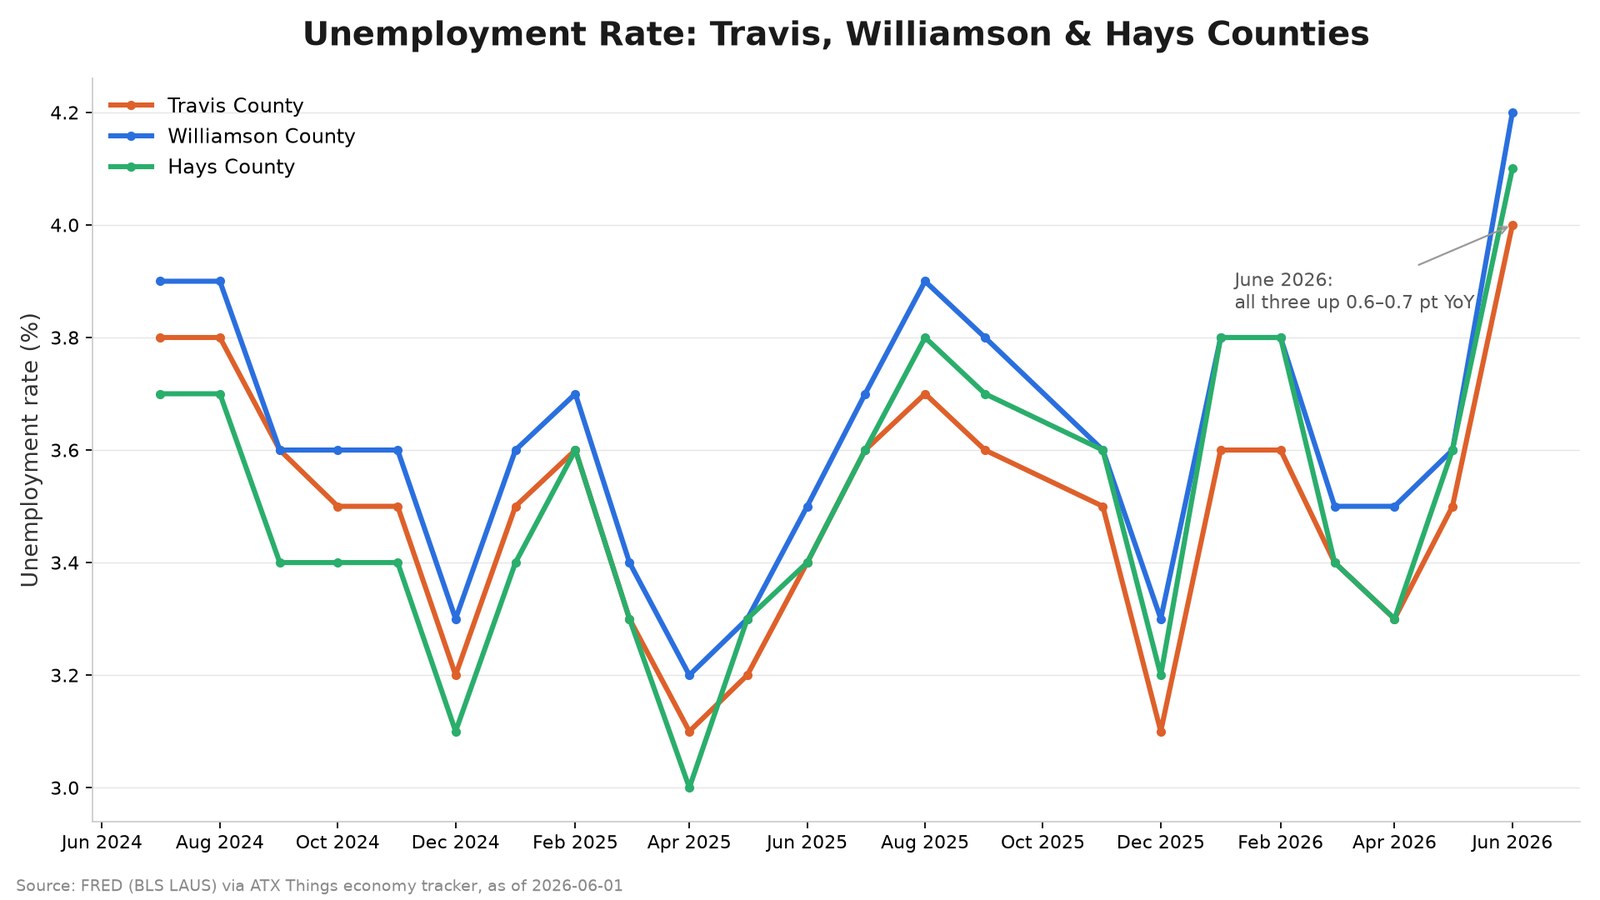
County-level unemployment in this dataset moves seasonally — every county shown here has dipped each winter and climbed into early summer for the past two years. That seasonal pattern is real, and it's part of why comparing June 2026 to June 2025 (rather than to the prior month) is the honest read. Even accounting for that seasonal rhythm, each county's June 2026 level sits meaningfully above where it stood at the same point last year. Travis County's labor force also grew slightly (+0.7% YoY to 877,599), as did Williamson's (+1.0% to 436,193) and Hays's (+1.0% to 170,346) — so more people are in the labor force even as a higher share of them are between jobs.
How Much Have Austin Home Prices Actually Fallen?
The metro's median home listing price — what's on the market right now, not what already closed — was $461,887 in July 2026. A year earlier, the same FRED series implies a comparable listing price of roughly $510,900. That's a difference of about $49,000, a real number straight from the arithmetic of the reported 9.6% year-over-year change, not an estimate.
The rest of the housing indicators in this dataset move in the same direction as price: active listings are down 3.6% year-over-year to 12,655, and the median days a home sits on the market fell 6.9% to 67 days. Fewer homes are sitting on the market, and they're moving somewhat faster than a year ago, even as the asking price has come down — three numbers pointing the same way, all from the same July 2026 pull.
These are listing prices — what sellers are asking — not closed-sale prices. FRED's series for this metro (MEDLISPRI12420) tracks active listings, so it reflects what's currently for sale, not the final price homes actually sold for.
How Does Austin Compare to Dallas, Houston, and San Antonio?
Austin's unemployment increase isn't unique to Austin. Every core county checked in Texas's four biggest metros saw its unemployment rate rise year-over-year through June 2026 — Austin's three counties just happen to sit in the middle of that pack, not at either extreme.
| County (metro) | Unemployment, June 2026 | June 2025 | Point change |
|---|---|---|---|
| Travis (Austin) | 4.0% | 3.4% | +0.6 pt |
| Williamson (Austin) | 4.2% | 3.5% | +0.7 pt |
| Hays (Austin) | 4.1% | 3.4% | +0.7 pt |
| Dallas (Dallas–Fort Worth) | 3.4% | 3.1% | +0.3 pt |
| Tarrant (Dallas–Fort Worth) | 4.7% | 4.0% | +0.7 pt |
| Bexar (San Antonio) | 4.8% | 4.1% | +0.7 pt |
| Harris (Houston) | 5.4% | 4.8% | +0.6 pt |
Dallas County posted the smallest year-over-year increase of the seven counties in this comparison, at +0.3 point. Williamson, Hays, Tarrant, and Bexar all rose by the same +0.7 point margin. Harris and Travis both rose +0.6 point. Read plainly: Austin's three-county rise matches, rather than exceeds, what happened in the state's other major metro cores this year.
We're not publishing a metro-level home price comparison against Dallas, Houston, or San Antonio this month — FRED's median-listing-price series in our tracker only has current data populated for the Austin metro row, and we're not going to estimate or borrow a number for a metro this dataset doesn't actually cover.
The Construction Tie-In
Building permits pulling back 11.2% year-over-year while construction employment keeps growing is a real tension worth watching, not resolving here — permits filed today become the jobs of a future month, and a slower filing pace can take time to show up in employment counts, or it may not show up at all if current backlogs are large enough to keep crews busy regardless. Zabalist, ATX Things' sister platform, tracks the underlying project-level filings — TDLR registrations, city site plans, and building permits — behind this month's permit count, project by project, if you want to see what's actually moving through the pipeline right now. Our own Austin Development Report covers the same underlying permit and project data from the construction side, month over month.
What Locals Should Know
If you're house-hunting right now, the combination this month is unusual: prices down, but listings also down and moving faster (67 days on market, −6.9% YoY). That's not "more houses to choose from" — it's a smaller, faster-moving market at a lower price point than a year ago.
A rising unemployment rate doesn't mean the same thing at 4.1% that it would at, say, 7% — Austin's rate is still historically low by pre-2020 standards. This snapshot reports the year-over-year direction and size of the move; it does not predict where the rate goes next.
Track the live numbers behind this piece any time at ATX Things' economy tool, the Austin metro dashboard, and the housing data tool — all pull from the same FRED-sourced tables this article does.
Method & Sources
Every figure above comes directly from msa_economic_data (Austin-Round Rock-Georgetown metro, FRED CBSA code 12420) and county_economic_data (Travis, Williamson, Hays, Dallas, Tarrant, Bexar, and Harris counties) in ATX Things' own economy tracker, itself sourced from the Federal Reserve Economic Data (FRED) system and the Bureau of Labor Statistics' Local Area Unemployment Statistics program, pulled August 17, 2026. Metro-level figures (home price, permits, GDP, wages, listings, days on market) reflect FRED's July 2026 observation; county-level unemployment figures reflect FRED's June 2026 observation, one month behind because BLS county data (LAUS) is reported on a lag. Year-over-year point changes for unemployment were calculated from each county's own reported percent-change figure against its current rate. One data quality note, in the interest of full transparency: Dallas County's labor-force count in this dataset returned an implausible figure (a fraction of what a county its size should show), so we excluded county-to-county labor-force comparisons from this piece entirely rather than publish a number we don't trust — the unemployment rate figures used throughout are unaffected and were checked for plausibility against each county's known population scale.
FAQ
Is Austin's unemployment rate high right now? At 4.1% (June 2026), Austin's metro unemployment rate is up 0.6 point from a year earlier, but it remains below Houston's core county (5.4%) and San Antonio's core county (4.8%) for the same month. It is not, by itself, a historically high rate.
Are Austin home prices actually going down? The metro's median home listing price fell 9.6% year-over-year to $461,887 in July 2026. That's the asking price on active listings, not the final price of closed sales, which FRED's series for this metro doesn't separately track.
Which Austin-area county has the highest unemployment rate? Of the three core counties, Williamson had the highest rate in June 2026 at 4.2%, just ahead of Hays at 4.1% and Travis at 4.0%.
How does Austin's economy compare to Dallas, Houston, and San Antonio right now? On unemployment, Austin's three core counties moved in the same direction and roughly the same magnitude as Dallas–Fort Worth, Houston, and San Antonio's core counties this year — Dallas County had the smallest increase of the seven counties compared, at +0.3 point.
Are Austin building permits down because the economy is slowing? Building permits are down 11.2% year-over-year, but this snapshot doesn't draw a conclusion about cause — construction employment grew 6.6% over the same period, so the two indicators are currently moving in opposite directions, not confirming a single story.
Related Austin Data
More Austin Guides
Share this article